
By Myer Harrell
Myer Harrell is a Principal and the Director of Sustainability at Weber Thompson. He believes in the power of design to promote a sustainable future and manages the firm’s initiatives to that end.
Myer’s current project focus is urban boutique-scale commercial office construction
How fast are we going?
Think of the dashboard in your car. You can see your speed, how much fuel you have left, and whether you need to go to the mechanic. Having this real-time information helps you the driver achieve specific goals, like getting to your destination and staying safe.
It’s similar with buildings. Watershed, a Weber Thompson-designed mixed-use office building in Fremont completed in 2020, is participating in the City of Seattle’s Living Building Pilot Program (LBPP). This means that in exchange for additional development height and area, the project must achieve Living Building Challenge (LBC) Petal Certification along with energy and water usage goals during the first two years of occupancy:
- 25% lower energy than a baseline building
- 75% lower potable water use than a baseline building
To meet these goals, it’s not enough to have a thoughtful, integrated design (which we do), or to consider energy and water efficiency through passive design strategies and smart system selection (which we also do). Ultimately, it requires active participation by every person in every tenant space to guarantee that the building performs.
A tour of the WT dashboard
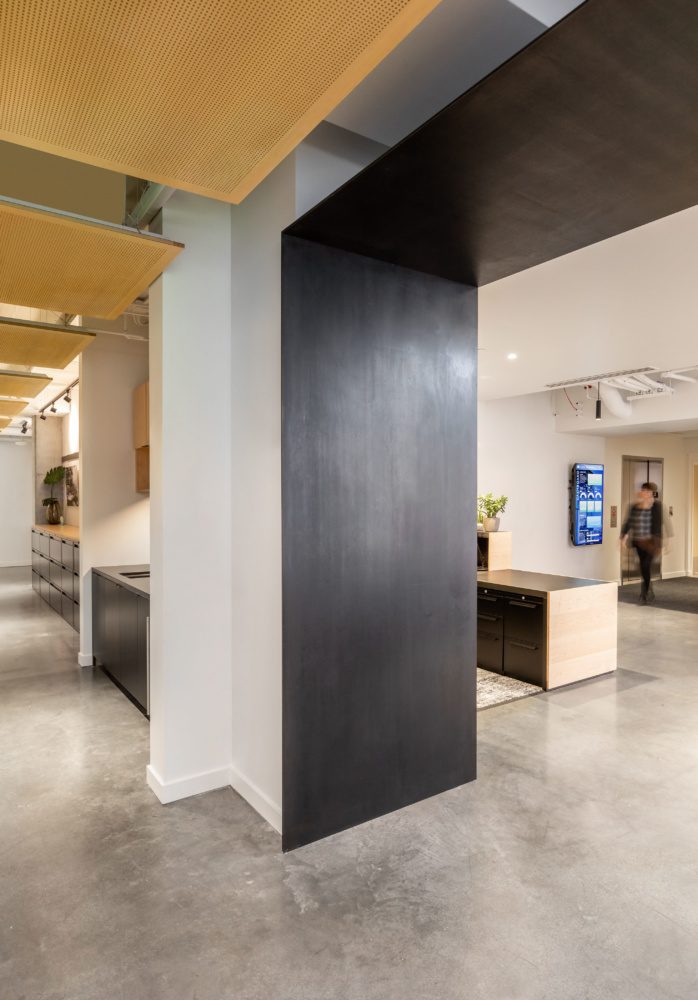
As one of the Watershed tenants, our dashboard is featured prominently on a digital screen in our lobby. It is hosted on a website that‘s easily accessed on any computer to provide real-time feedback and influence our behavior. The energy and water meters regularly send information to the website every fifteen minutes.
At the smallest timescale, we have three daily “speedometers” that tell us how much energy we’re using for specific uses right now – plug loads, lighting, and HVAC – and whether we’re on track for our daily targets.
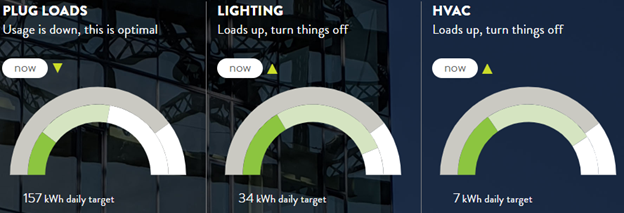
Energy submeter daily “speedometers.” The dark green bars show current use so far today; light green bars show the anticipated total for the day, and the grey bar shows the target.
The primary audience for the speedometers is the Weber Thompson employee. At this scale, we can see the relative impact by energy demand type (e.g., on average, plug loads will use about five times the energy as lighting). These speedometers give direct feedback and instructions to employees to change behaviors (unplugging equipment, turning off lights, changing setpoints on thermostats) or contact building maintenance (for HVAC & lighting problems that can’t be solved by user behavior).
However, seeing one day’s data is not enough. We also display the next largest timescale on the dashboard to see how we’ve been doing over the past two weeks.

Energy submeter two-week bar charts. The up- and down- triangle symbols indicate whether we are above or below our daily average target.
These bar charts can help us ask and answer bigger questions – is our HVAC system using more energy than we’d expect for this season? Are lights going off on evenings and weekends? Are there dips and spikes we can explain with anomalies like special events and office closures?
For employees, these bar charts give more indirect feedback, encouraging overall habits, rather than minute by minute changes. They also indicate whether we are on target (based on annual averages) and how our energy use compares to last year. They also provide transparency about WT operations and can be a conversation starter for stories and lessons learned.
Finally, zooming out to the largest timescale – we track energy and water use on a month-to-month basis for an entire year. This is the best indicator of whether we’re on target for compliance with the Seattle Living Building Pilot Program, which requires submitting twelve months of utility data to the city. We need to look beyond a day or even a few weeks to know if we’re truly on track or if we need to make major adjustments.
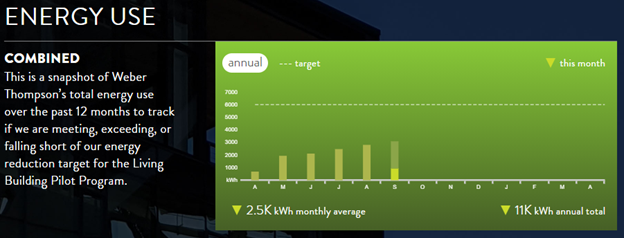
Energy and Water Use annual bar charts. Here we see larger trends, monthly averages, and annual totals against our targets.
This scale is all about transparency and accountability, with its audience being the world outside WT. These charts provide immediate, visual data points indicating whether we are meeting the LBPP goals. They also compare against the previous year’s data, and seasonal changes in our energy and water use, supporting stories and lessons learned.
WT’s carbon footprint
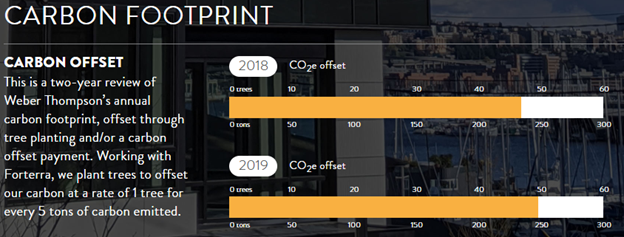
Carbon Footprint
Weber Thompson has a long history of tracking our annual carbon and offsetting through tree planting and carbon offsets. To give our employees and visitors greater awareness of these efforts, we included that effort on the dashboard as well in a year-to-year comparison bar graph.
Conversations for the future
Every two weeks, we give a brief report to the firm to share our progress on energy and water targets and increase the dashboard’s visibility. We discuss issues as they come up, using the dashboard as a tool for feedback and learning. With consistent engagement, we all participate in the successful performance of our space and will celebrate when we reach our destination.
We’re happy to report that we are on track to meet the energy and water goals, possibly ending our official reporting period later this year.
Our overarching goal is to track this information, both during the critical first two years of occupancy as we comply with the LBPP, and for the life of our tenancy. This work informs our employees, clients, and ultimately our future projects. Like the car dashboard, it only works if you are paying attention.
A huge thanks to the whole dashboard team for their help with this project:
- RMB Vivid for the front-end dashboard design
- Metric Media for the website build
- ATS provided the back-end data support
- WSP Built Ecology provided support setting specific energy and water goals for tenant spaces (and was also the MEP design engineer for the core and shell Watershed building).